Our Work
Water Quality Testing
Water Quality Testing
Introduction to the project
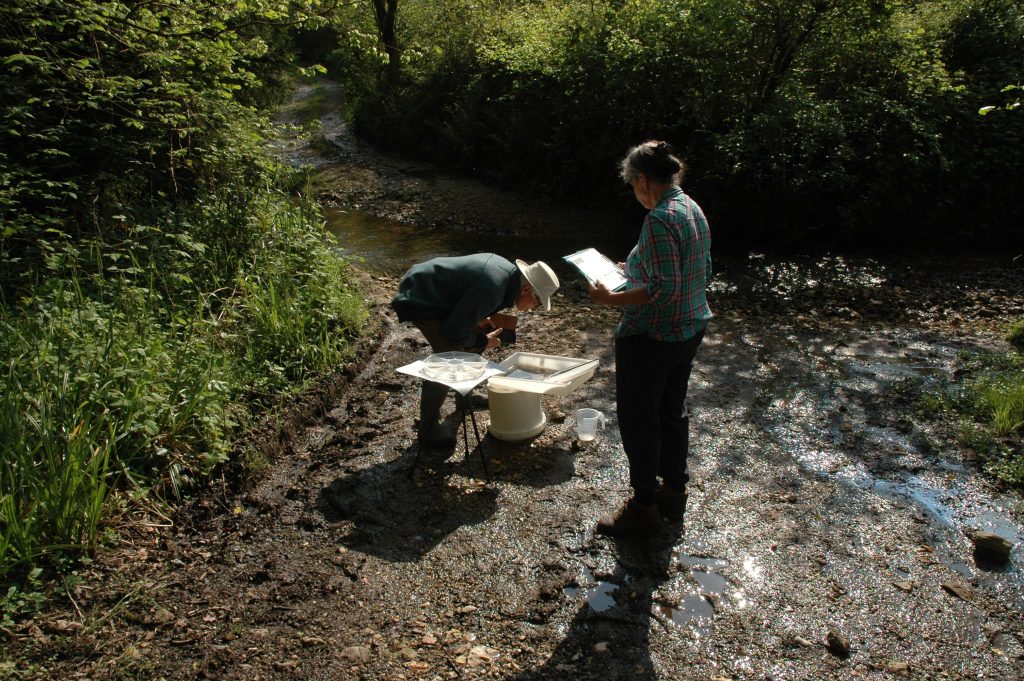
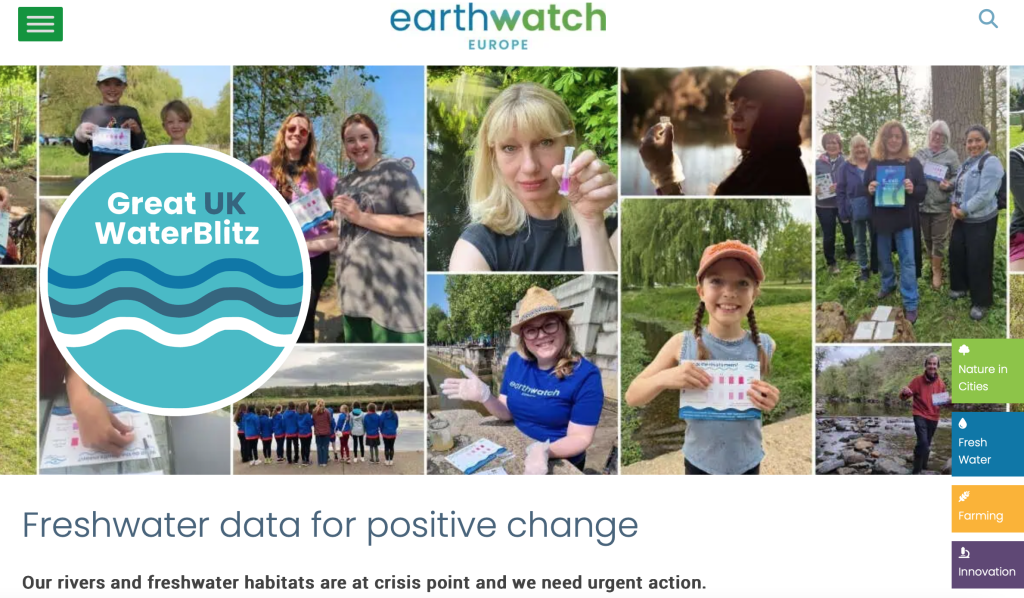
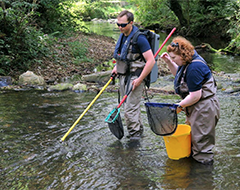
This project is a Westcountry Rivers Trust Citizen Science Investigation scheme (WRT CSI). Each month, a team of volunteers test the water quality at various locations within the Sid valley. We also take part in Earthwatch Europe’s Great UK Water Blitz which is held twice a year in April and September. It calls on locals to test their local rivers, streams and lakes with kits provided to help feed results into a national water quality database.
- To regularly record the quality of the water in the River Sid and its main tributary streams at specific sites within the catchment.
- To also monitor Bickwell Brook and its tributary to the west of the valley and Salcombe Regis Stream, which is within Sidmouth political jurisdiction.
- To build up a database to enable changes to be identified.
- To use the data to help inform projects in the valley.
Value of the data:
We have been monitoring at most sites for 5 years and have built up an overall picture of the water quality across the catchment. This enables us to identify any changes and share data with the EA when reporting pollution incidents.
Project Details
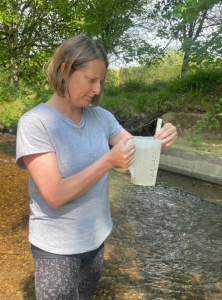
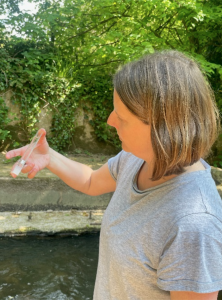
Our volunteers are registered with the Westcountry Rivers Trust Citizen Science Investigation (WRT CSI) and visit their monitoring site monthly.
To understand our watercourses, we record features such as river channel width, water depth, rate of river flow, the character of the river bottom, potential sources of pollution, land use on the adjacent banks, presence of Invasive species such as Himalayan balsam and Japanese Knotweed, wild life present in and around the water e.g. wagtails, dippers, kingfishers, water measurers, fish and otters. We measure 4 parameters to indicate water quality, namely temperature, total dissolved solids (TDS), turbidity and phosphate.
Current Testing Sites
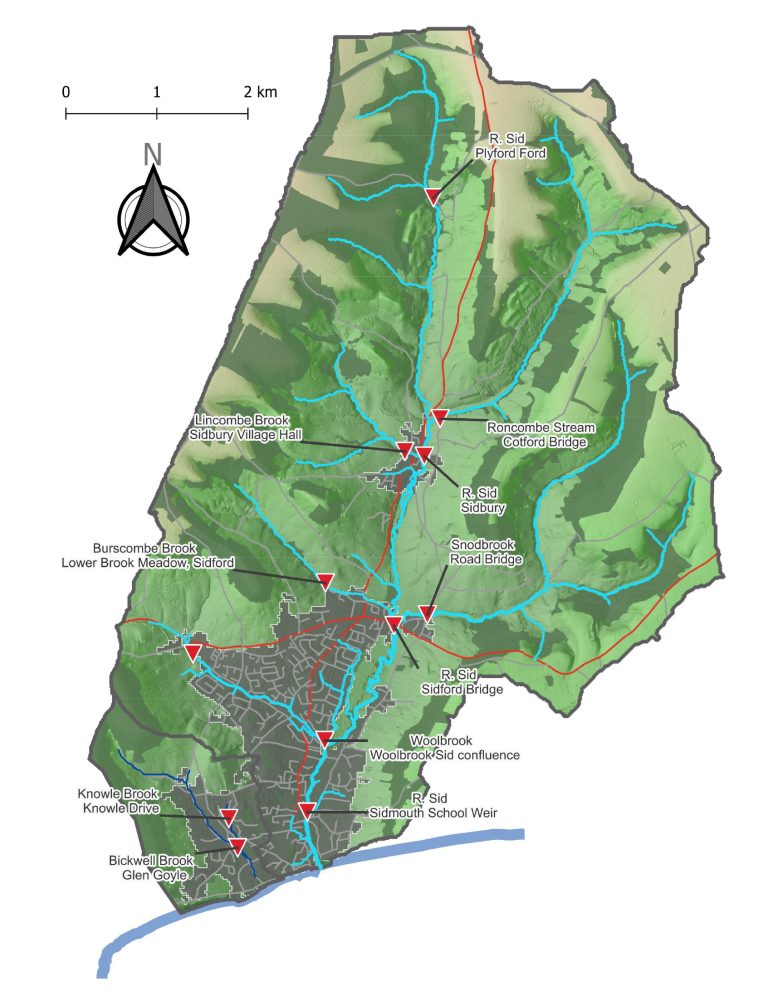
Interactive Map
Use the interactive map below to find out more about our water quality testing sites, riverfly monitoring locations, and other related or notable sites within the valley.
Interactive Map
Droplets = Water Quality Testing Sites
Mayfly = Riverfly Monitoring Locations
Buildings = Sewage Treatment Works
Orange Circles = Combined Sewage Outlets
Fish = Electrofishing Sites
Temperature
This changes with the seasons, the range is generally 6C – 17C. The highest readings are usually in July and August. A rise in temperature brings about a decrease in the amount of oxygen dissolved in the water. Toxic chemicals e.g. cadmium zinc and lead dissolve more easily in warmer water and aquatic creatures are less able to withstand the effects of poisons. Raised temperatures can cause fish to spawn and hatch out of season. Shading by watercourses helps to protect against heat. In the long term, our data on temperature may reveal the effect of climate change.
Total Dissolved Solids (TDS)
The quantity of dissolved chemicals is directly related to the conductivity of the water. The more minerals, salts and metals dissolved in the water the more conductive it becomes and the higher the reading. There are natural sources of dissolved solids e.g. calcium, magnesium and potassium, which are influenced by rock and soil types in the catchment together with the length of time the water has been in contact with the land.
Man made sources include farm run off from fertilisers, pesticides and herbicides and urban run-off from vehicles, road abrasion, garden chemicals and corroded metals. Sudden drops in river water TDS appear to be directly related to heavy rainfall but in times of drought the dissolved solids can be concentrated and readings elevated.
High TDS can negatively impact aquatic life by altering water chemistry. The water may become more acid or alkaline, oxygen levels can be reduced and sensitive organisms may become dehydrated. This is known as osmotic stress and affects trout eggs in the early stages of development.
TDS readings increase in the Sid as we travel downstream. The upper Sid at Plyford rarely exceed 70ppm, at Sidbury readings increase to 100 – 150ppm, in Sidmouth, at School Weir, TDS are usually above 165ppm and can reach 200ppm when water levels are low.
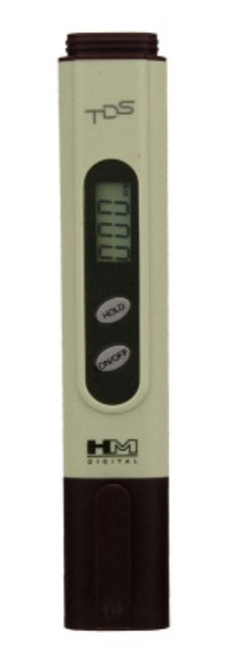
A probe for monitoring temperature and TDS
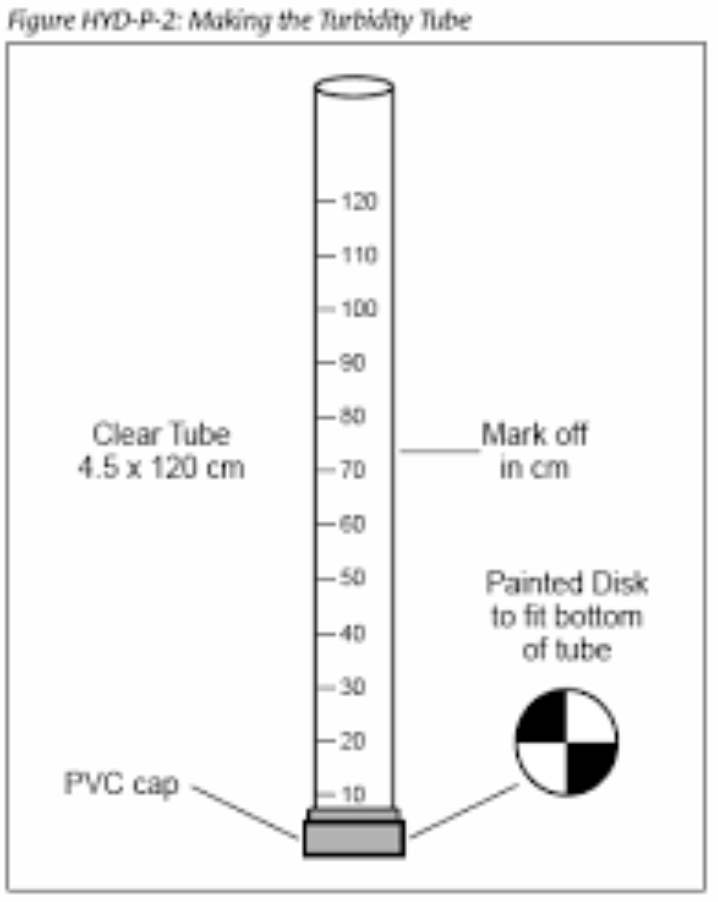
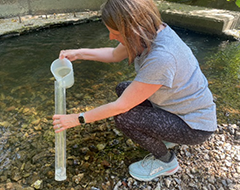
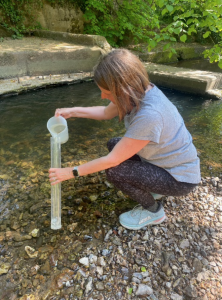
Turbidity Monitor A measuring cylinder with a secchi disc, which is a 20 cm disc with alternating black and white quadrants, is placed at the bottom.
Turbidity
Turbidity is a visual measure of water clarity. We test this by looking down through the water sample collected in a measuring cylinder at what is called a secchi disc.
In dry weather the Sid is very clear but after rainfall brown soil muddies the water. After heavy rainfall, red soil from our hillsides flows into the river and out to sea. The soil, which sustains us, is steadily being lost. Not only a problem for farmers and our food supply but for biodiversity.
The muddier the water the lower the volume of water needed to hide the disc. Mud suspended in the water means less light reaches aquatic plants diminishing their ability to photosynthesize and grow. Mud which settles on the river bottom smothers the stones and gravel, compromising aquatic organisms’ ability to breathe and spoiling the clean gravels where fish spawn. Particles of mud can have unwelcome chemicals from pesticides, fertilizers and other sources attached to their surface.
Phosphates
Phosphate occurs naturally within the river ecosystem, but in low levels under 100ppb. Higher levels may indicate anthropogenic input.
Phosphates are essential for plant and animal growth. But human activities can add excessive amounts to the environment. Algae respond with rapid growth in still water areas and this prevents light reaching aquatic plants. and lowers oxygen levels, bad news for fish and most aquatic invertebrates.
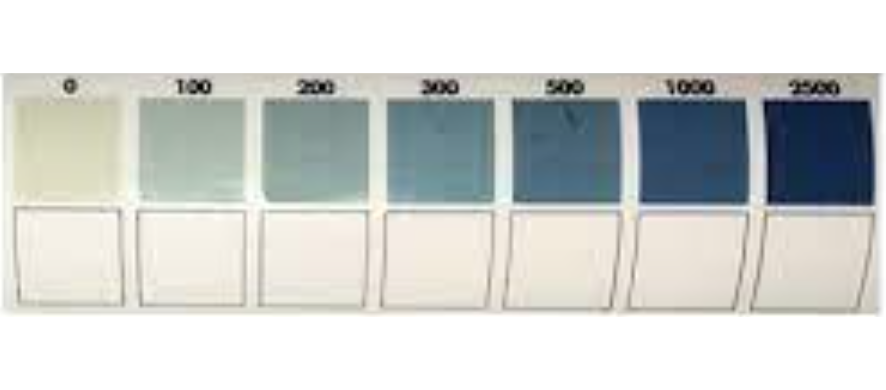
We test with a phosphate indicator strip and a colour chart. The indicator strip is put into a tiny test tube with a 10ml. water sample; the test tube is turned up and down 5 times. The indicator strip turns blue. The shade will vary according to the amount of phosphate present.
- Normal O – 100ppb
- High 200 – 300 ppb
- Too high 500ppb – 2500ppb

Sources of phosphates in the Sid Valley are:
- agricultural e.g. fertilisers and slurry
- urban e.g road run off and cleaning products.
We can select phosphate free cleaning products to prevent so much phosphate reaching our river and coastal environment where it can promote algal blooms. Phosphate is necessarily added to treated water because it protects old lead pipes from corrosion which otherwise might contaminate our drinking water. Woolbrook readings have been known to exceed 500ppb. In summer 2024 we had a harmful algal bloom in the lower reaches of the Sid.
Health and Safety
The Westcountry Rivers Trust give clear guidance on safely taking water samples, which should be followed and one is expected to complete a dynamic risk assessment prior to taking a sample. We do not sample when the river is in spate.
WRT CSI Survey Results
Annual water quality testing results from the Westcountry Rivers Trust Citizen Science Investifations (WRT CSI) can be viewed on our Resources Page or via the button below.
You can volunteer to help with our water quality testing by registering your interest on the Get Involved page.
Earthwatch Europe's Great UK Water Blitz
The basic kit tests for phosphates and nitrates. The tests are carried out over a 4 day period and the results entered on line.
This is a biannual event taking place in April and September. Earthwatch publish a Report of the National results. https://earthwatch.org.uk/
Updated: 06/11/2025 .
Other Projects
Take a look at some of our other work and projects.
Newsletter
Subscribe to the newsletter to stay up to dates with the latest news along the River Sid,
including conservation work, volunteering opportunities, and useful information.

